1800 615 6344
 My Account
 Trade Application


Total Transparency
Every test.
Every number.
Yours to see
We know how hard it is to keep pressures and fluid temps tight during testing. Plenty of people claim they do it — we actually show you the results. Every bit of testing data we capture lives on the cloud, and it's easy to get to from your phone or PC, anytime.
3.0018 bar. 13.58 seconds in.
The chart above is a real fuel-pressure trace, captured while we determined the high-flow slope of one injector in a set. Each green clump is 100 flow samples.
Hover any point and you see the exact reading. Here, 13.58 seconds into the test the fuel pressure sat at 3.0018 bar — locked on the 3 bar target.
That stability is the whole point: hold pressure and temperature steady, and the flow numbers you get are numbers you can trust.
Click a serial. See everything.
Flow profile
The full flow curve measured across the injector's operating range.
Flow rates
What your injector actually flows — measured, not the rated figure.
Dead times
Opening and closing latency, recorded individually for each injector.
Testing parameters
The exact pressure, temperature and voltage for every test.
On the cloud. On your phone.
Log in from any PC
Your set's full testing data is stored on our cloud server. Log in and view it whenever you want — nothing is hidden.
Scan it on your phone
Every set ships with a QR code. Scan it to pull up your injectors' data on your phone in seconds.
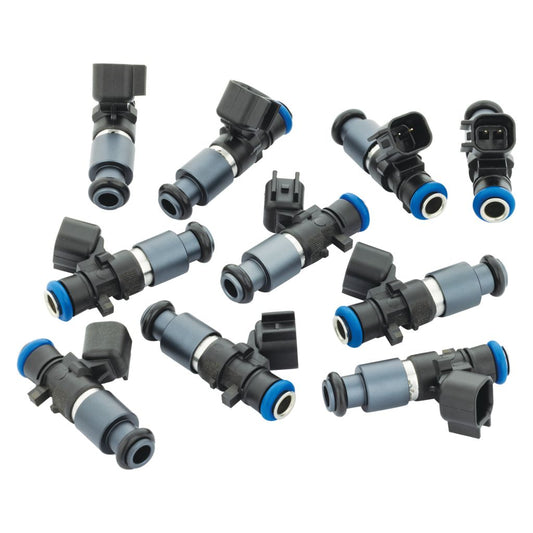
Buy a set. See the data
SHOP INJECTORS
-
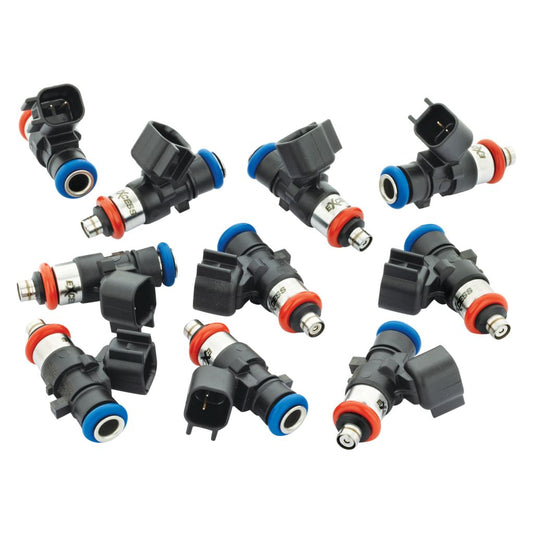
1500cc Dodge Viper ZB2 VX1 Fuel Injectors
Regular price $2,050.00Regular priceUnit price per -
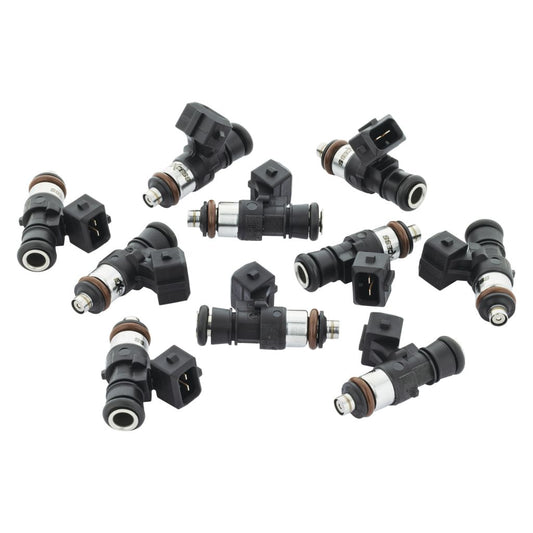
1500cc Dodge Viper ZB1 Fuel Injectors
Regular price $2,050.00Regular priceUnit price per -
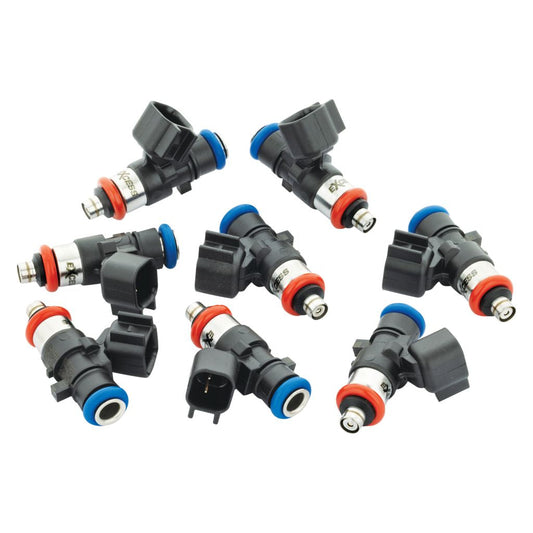
1500cc Ram SRT10 Fuel Injectors
Regular price $2,050.00Regular priceUnit price per -
1500cc HSV 6.2lt LSA, LS9, LS3 Fuel Injectors
Regular price $1,600.00Regular priceUnit price per